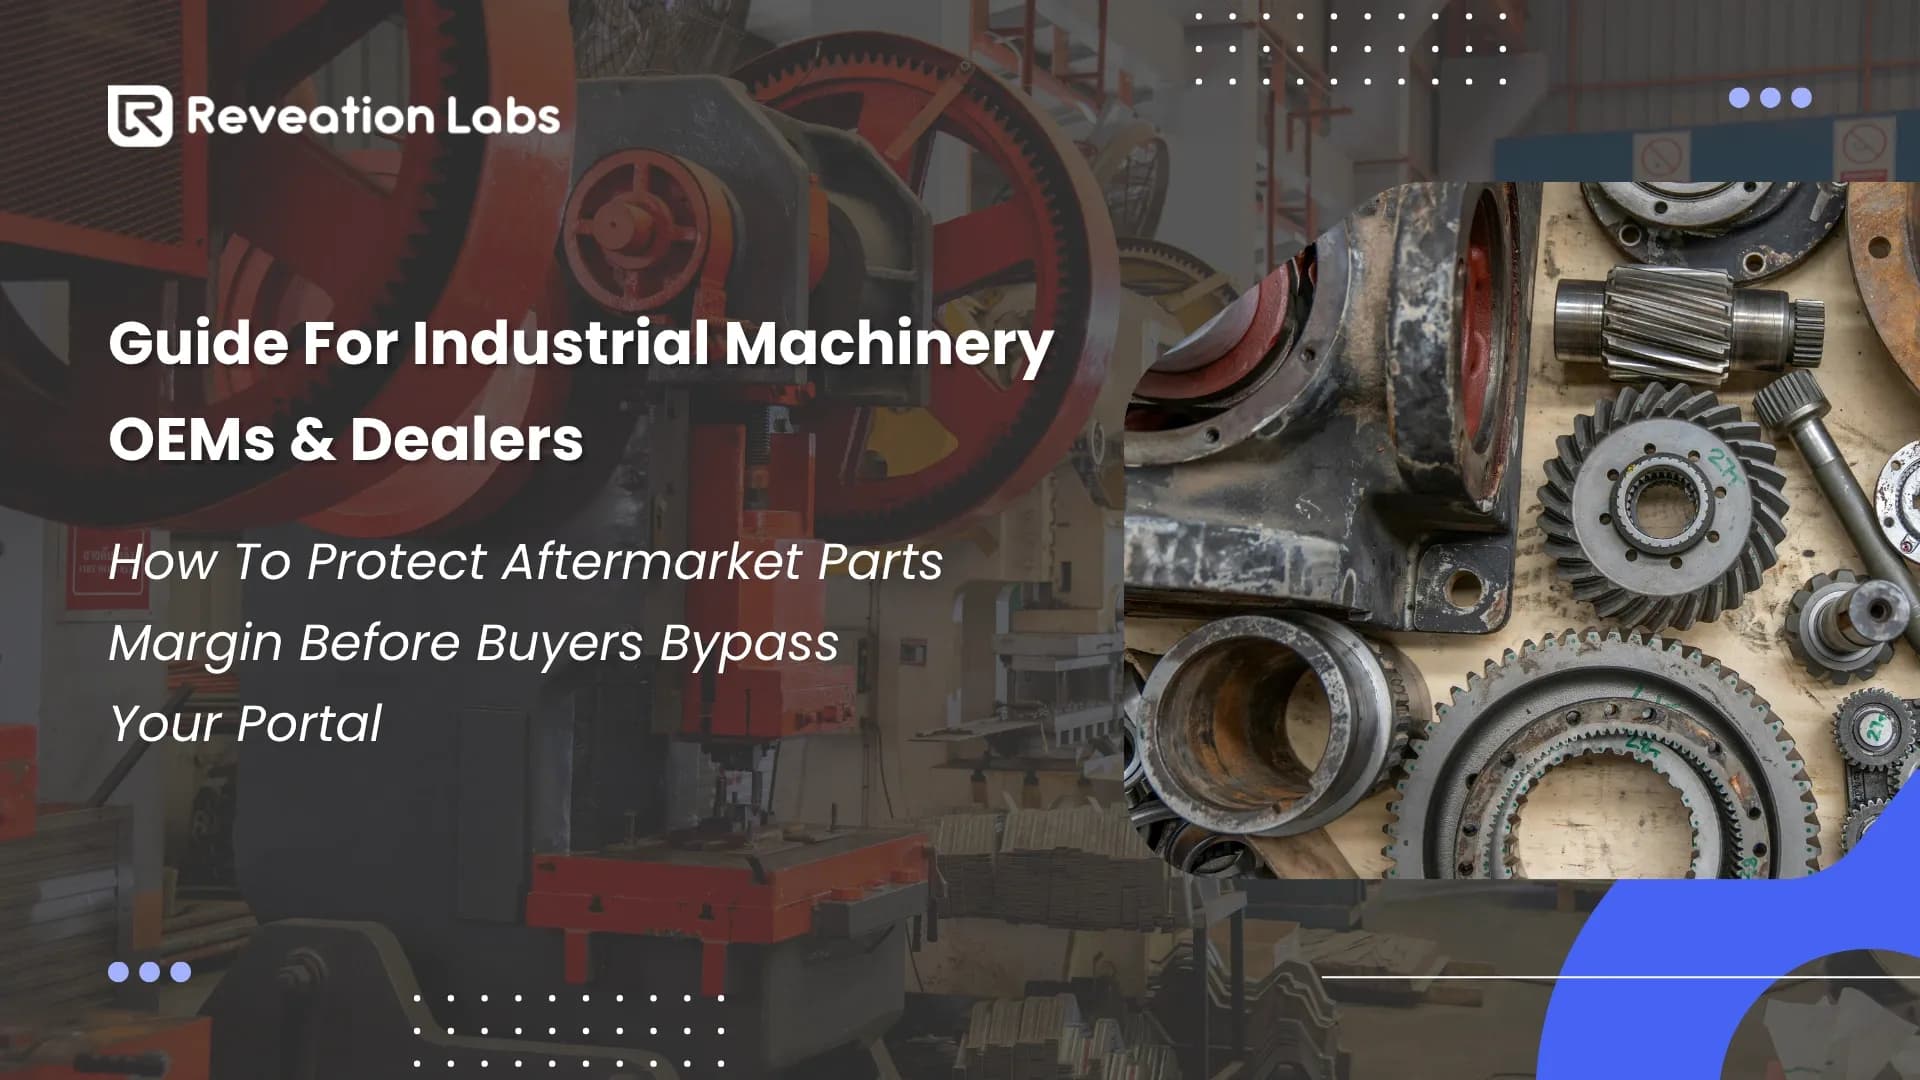

For industrial machinery manufacturers, the core P&L reality is straightforward: aftermarket is often the margin engine, while new equipment is often the volume engine. McKinsey reports that aftermarket EBIT margins average about 25% versus roughly 10% for new equipment across 30 industries, and that parts gross margins are often above 30% while maintenance services are closer to 10%. In practical terms, the installed base is not just a service obligation. It is the highest-leverage commercial asset on the balance sheet.
Yet many machinery OEMs still run aftermarket and quote-to-order as fragmented motions. Sales, service, operations, and finance see different versions of demand. Pricing teams cannot consistently control the price waterfall across direct, dealer, and distributor channels. Long-tail spare parts remain under-managed. Gap-to-entitlement is rarely measured with precision. The result is revenue leakage that compounds quietly and then appears as broad gross-margin pressure.
The buyer environment has shifted in parallel. McKinsey's B2B Pulse 2024 shows B2B eCommerce now represents 34% of revenue for B2B organizations that offer it and that buyers increasingly accept large digital order values, with 39% willing to spend more than $500,000 in one remote or self-serve transaction. This is no longer a small-order channel story.
At the same time, channel behavior is not purely digital. Gartner reports that buyers using hybrid digital-plus-human interactions are 1.8 times more likely to close a high-quality deal. The implication for machinery OEMs is specific: do not frame this as "digital versus field sales." Frame it as higher-quality B2B eCommerce commercial execution across the installed-base aftermarket lifecycle.
Leadership implication: this is not a website project. A B2B eCommerce solution for Industrial Machinery is a margin-defense and aftermarket-capture program anchored in spare-parts reorder, gap-to-entitlement recovery, quote-to-order speed, and dealer portal discipline.
This resource argues for one integrated B2B eCommerce response:
Aftermarket margin: Recover aftermarket margin through better long-tail parts pricing, fitment and supersession confidence, and channel execution.
Quote speed: Compress quote-to-order cycle time in ETO/MTO/CTO motions.
Lifecycle value: Increase attach rates for service and lifecycle offers at quote stage.
Channel control: Reduce grey-market leakage by tightening dealer portal and price waterfall discipline.
Management system: Build a management system that connects commercial activity to EBIT outcomes.
Industry Pressure Points
Industrial machinery leadership teams are currently navigating five structural pressures that directly affect margin quality.
Pressure 1: Installed-base growth without proportional capture
Many OEMs have expanded their installed base over the last decade, but parts and service capture has not grown at the same rate. This creates a widening gap-to-entitlement. Customers still buy replacement parts, but too much spend shifts to independent channels, unauthorized substitutes, or deferred maintenance.
Pressure 2: Price waterfall deterioration across channels
In dealer and distributor models, list price rarely equals realized price. Discounting, rebates, regional adjustments, and ad hoc exceptions can erode realized margin quickly. Without active waterfall governance, leadership sees the outcome only in quarterly variance reports rather than at transaction level.
Pressure 3: Long-tail parts complexity
Machinery OEMs often carry tens of thousands of active and legacy spare-part SKUs. McKinsey notes that long-tail parts pricing is a major source of untapped EBIT, with 3% to 10% EBIT uplift possible through improved pricing execution. Long-tail economics are commercially strategic, not back-office noise.
Pressure 4: Slow and inconsistent quote-to-order cycles
ETO/MTO/CTO business models require high confidence on feasibility and margin before commitment. When quoting is manual and cross-functional handoffs are unclear, cycle time expands, conversion drops, and sales teams discount to preserve close probability.
Pressure 5: Buyer expectations have reset
Forrester reports that 64% of B2B buyers in manager-and-above roles are Millennials or Gen Z. These buyers expect transparent information, clear trade-offs, and faster decision support, even for complex products.
Additional context increases urgency
- Gartner coverage in Digital Commerce 360 cites 67% preferring rep-free purchasing in one survey cut, while Gartner's eBook often cites 75%; these are different cuts and should be treated as related but not identical measures.
- Digital Commerce 360 reports U.S. B2B eCommerce reached $2.93T in 2025, with manufacturing and distribution continuing digital share gains.
- Deloitte reports 92% of manufacturers see smart manufacturing and digital operations as the main competitiveness driver over the next three years, and 80% plan to allocate at least 20% of improvement budgets to it.
These pressures concentrate in industrial-machinery-native B2B eCommerce workflows:
- Aftermarket spare-parts reorder must be faster and more trusted than independent channels.
- Gap-to-entitlement targeting must connect installed-base data to actionable commercial plays.
- Long-tail parts pricing must stay governed across direct, dealer, and distributor paths.
- Quote-to-order for ETO/MTO/CTO must reduce exception loops without sacrificing margin floors.
- Dealer portal controls and price waterfall governance must reduce grey-market leakage.
- Fitment and supersession confidence must convert BOM/PLM truth into commerce-ready decisions.
When these capabilities are unmanaged, OEMs absorb cost through aftermarket share loss, quote discounting, and progressive line-item migration. B2B eCommerce becomes the control layer that keeps commercial policy executable under that pressure.
These are not isolated trends. Together they define a new commercial baseline for machinery OEMs.
Why Now
The strongest reason to act now is financial timing. Margin recapture in aftermarket does not require waiting for a full product-cycle reset. It can begin in current-year execution through pricing, channel, and service-attach improvements if governance is disciplined.
McKinsey's documented case examples show that an industrial machinery player improved EBIT margin by two points in one year by repricing 100,000 spare-part SKUs, while a power-equipment OEM increased aftermarket revenue by 20% through bundled offerings. These are operational interventions with clear P&L pathways.
The demand side is also favorable now. McKinsey B2B Pulse 2024 indicates:
- 71% of B2B firms now offer some form of B2B eCommerce.
- In-person sales contribution has declined versus prior years.
- Buyers are comfortable with large digital orders and more channel switching.
For machinery manufacturers, this means the addressable B2B eCommerce-plus-assisted order pool is already large enough to justify focused investments. Leadership does not need to bet on a distant behavior change.
Competitive sequencing
Valtech and Copperberg data, reported by Digital Commerce 360, shows digital channels account for a larger share of aftermarket sales than new equipment sales and that manufacturers are increasing investment in customer portals and dealer portals. This source should be treated as medium confidence and European-skewed, but it is directionally consistent with broader B2B eCommerce market signals.
Evidence quality
Older trend data should be used with caution. McKinsey's 2016 to 2019 digital baseline work remains useful for directional context, but it is medium confidence for current-state magnitude because it is pre-pandemic. The better approach is to anchor decisions in 2024 to 2026 data and use older studies only to confirm trajectory.
Current-State Operating Model
Most industrial machinery OEMs run two linked revenue motions that are managed separately:
- Installed-base aftermarket spare-parts sales through B2B eCommerce and assisted channels.
- Quote-to-order for configurable equipment and packages across ETO/MTO/CTO models.
When these motions are disconnected, value leaks in predictable places.
4.1 Typical aftermarket motion
- Customer equipment fails or reaches maintenance interval.
- Buyer or technician searches part references through a dealer, branch, or internal team.
- Fitment is validated manually against model, serial history, or local expertise.
- Pricing and availability are checked through separate systems or people.
- Order is placed, adjusted, or abandoned based on confidence and response speed.
Where leakage occurs:
- Slow fitment confirmation pushes urgent orders to alternate channels.
- Grey-market substitution increases when lead times and confidence are unclear.
- Channel discounts are applied inconsistently to close transactions quickly.
- Service opportunities are missed because attach prompts are not systematic.
4.2 Typical quote-to-order motion for ETO/MTO/CTO
- Opportunity is qualified by sales.
- Configuration and commercial terms are assembled.
- Engineering validates feasibility and risk.
- Pricing and margin are checked.
- Approval loops continue until a final quote is issued.
Where leakage occurs:
- Rework cycles increase labor cost per quote.
- Delayed responses reduce win rates in competitive bids.
- Non-standard discounting is used to preserve close probability.
- Hand-offs obscure true cycle-time root causes.
4.3 Commercial operating picture
| Motion | Typical symptom | P&L impact |
|---|---|---|
| Parts ordering | High dependency on manual fitment support | Lower share of wallet, higher support cost |
| Service offers | Low or inconsistent attach-rate prompting | Lost recurring margin and lower lifetime value |
| Long-tail SKU pricing | Stale rules and blanket markups | Persistent margin leakage |
| Dealer channel execution | Inconsistent policy application by region | Waterfall erosion and conflict |
| Quote-to-order cycle | Multi-step rework and approval loops | Lower conversion and higher cost-to-sell |
The summary diagnosis for leadership is not "we need one more portal feature." It is that the installed-base commercial system is under-instrumented and under-governed relative to its profit significance.
Technology Gaps
This is the core failure mode of a weak ecommerce solution for industrial machinery OEMs: aftermarket commercial controls are not executable at transaction speed across B2B eCommerce, dealer portal, and assisted channels.
Sections 1 to 4 show where value leaks. Section 5 maps the capability gaps that prevent scaling profitable execution.
5.1 Installed-base data and gap-to-entitlement clarity gap
Many OEMs can report shipments, but fewer can dynamically resolve "what is running where, in what configuration, and with what service entitlement" inside B2B eCommerce workflows. Without this visibility:
- Gap-to-entitlement cannot be prioritized effectively.
- Attach-rate actions are generic rather than targeted.
- Quote and parts teams cannot align lifecycle offers to real usage context.
5.2 Product fitment and supersession context gap
BOM and PLM context often exists for engineering, but is not converted into commerce-ready fitment and supersession decision support for B2B eCommerce and dealer portal teams. The business outcome is avoidable ambiguity on supersessions, compatibility, and replacement paths, especially in long-tail parts portfolios.
5.3 Price waterfall control gap across B2B eCommerce channels
Price logic is often technically present but operationally fragmented. Channel-, account-, and region-specific rules are difficult to enforce consistently in high-volume interactions. This is where realized gross margin slips despite stable list prices.
5.4 Quote-to-order rule codification gap
In ETO/MTO/CTO environments, feasibility knowledge remains concentrated in a limited set of experts. If quote-to-order rules are not codified and maintained as business assets for B2B eCommerce and assisted paths, quote quality depends on availability of individuals rather than repeatable process.
5.5 Process instrumentation gap
Leadership dashboards usually track revenue and backlog, but often miss process-leading indicators such as:
- First-pass fitment confidence rate.
- First-pass quote acceptance rate.
- Exception-loop volume in approvals.
- Share of demand diverted to alternate channels.
Without this instrumentation, corrective action starts too late.
5.6 Integration and workflow orchestration gap
Many teams operate with point-to-point process handoffs that are brittle under growth. This raises cycle time and control risk when volumes increase or product complexity rises.
| Gap area | Operating symptom | Financial effect |
|---|---|---|
| Installed-base visibility | Weak entitlement targeting | Lost aftermarket capture |
| Fitment and product context | High support burden | Higher cost-to-serve and lower conversion |
| Waterfall governance | Uncontrolled discounting variance | Gross-margin compression |
| Quote-rule codification | Rework-heavy quote cycles | Lower win rates and higher labor cost |
| Process instrumentation | Delayed root-cause detection | Slow margin recovery |
| Workflow orchestration | Frequent manual intervention | Scalability limits and service inconsistency |
Transformation Opportunities
The opportunity set should be sequenced by measurable margin impact, not by organizational ownership. The most effective B2B eCommerce programs target installed-base aftermarket value pools first, then connect quote-to-order improvements.
6.1 Opportunity map by value pool
| Opportunity | Primary mechanism | Expected P&L effect |
|---|---|---|
| Long-tail pricing discipline | Reprice and govern high-leakage SKU clusters | Gross-margin improvement and EBIT lift |
| Entitlement-based targeting | Direct actions where installed-base spend is leaking | Higher aftermarket revenue capture |
| Attach-rate expansion | Standardize lifecycle offer triggers | Higher recurring margin mix |
| Quote-cycle compression | Reduce rework loops and response latency | Better conversion and cost-to-sell |
| Channel conflict reduction | Clarify role, pricing, and fulfillment boundaries | Lower leakage to grey channels |
McKinsey's aftermarket work supports the magnitude of these pools, especially pricing and parts-margin performance.
6.2 Commercial plays that fit industrial machinery
- Installed-base "heatmap" prioritization: Rank accounts and fleets by gap-to-entitlement and service attach potential for B2B eCommerce recovery plays.
- Long-tail SKU control tower: Segment parts by demand, strategic criticality, and pricing sensitivity; apply governance by segment.
- Hybrid channel operating model: Use B2B eCommerce paths for spare-parts reorder speed and transparency, with specialist escalation for complex ETO/MTO/CTO conditions.
- Quote-quality gates: Standardize decision checkpoints to protect feasibility and margin before final proposal release.
- Lifecycle bundle motions: Pair equipment and parts-service offers earlier in the sales cycle.
6.3 Servitization connection
Servitization and service-as-a-product strategies fail when underlying parts and entitlement economics are weak. The right sequence is:
- Stabilize aftermarket capture and price realization.
- Improve attach rates and renewal discipline.
- Scale higher-value service outcomes.
This creates a financially defensible servitization path, not just a narrative.
Practical Use Cases
Use cases must match how OEM, dealer portal, sales, service, and operations teams actually work. Each use case below ties one B2B eCommerce operational change to one financial outcome.
Use case 1: Gap-to-entitlement recovery motion
Context: Installed base is large, but aftermarket spare-parts capture is uneven by account and region across B2B eCommerce and assisted channels.
Execution: Build account-level prioritization around expected spend versus captured spend, then route actions to channel owners with clear weekly targets.
Outcome: Faster recapture of leaking share in high-value segments.
Use case 2: Long-tail parts pricing margin defense in B2B eCommerce
Context: Legacy SKUs are priced with static logic and little active governance.
Execution: Segment long-tail SKUs in B2B eCommerce, apply differentiated long-tail parts pricing actions, and monitor realized margin variance weekly.
Outcome: Improved gross margin without waiting for major volume shifts.
Use case 3: Dealer portal conflict and grey-market reduction
Context: Direct and indirect channels compete in unclear ways, creating arbitrage and policy drift.
Execution: Define dealer portal and channel rules for who sells what, under which conditions, and at what commercial boundaries; reinforce with B2B eCommerce transaction monitoring and price waterfall controls.
Outcome: Better channel trust and lower unauthorized leakage.
Use case 4: ETO/MTO/CTO quote-to-order cycle acceleration
Context: Quote-to-order cycles are slowed by repeated feasibility and approval loops.
Execution: Standardize quote-to-order checkpoints for ETO/MTO/CTO, codify repeatable feasibility patterns in B2B eCommerce-assisted paths, and route exceptions to specialists based on pre-defined thresholds.
Outcome: Faster response times and improved close rates.
Use case 5: Service attach-rate lift at quote-to-order stage
Context: Service and parts packages are offered inconsistently across sales teams.
Execution: Embed commercial prompts and minimum-offer standards in every relevant quote path.
Outcome: Better recurring revenue mix and higher lifecycle value per sale.
Use case 6: CSCO-led service-level stabilization
Context: Parts fulfillment variability drives both customer dissatisfaction and emergency-cost spikes.
Execution: Prioritize inventory and fulfillment policy around installed-base criticality and demand volatility.
Outcome: Lower expedite costs and stronger renewal confidence.
| Use case | Primary owner | Co-owners | Core KPI |
|---|---|---|---|
| Entitlement recovery | CRO or VP Sales | CFO, VP Operations | Recovered aftermarket share |
| Long-tail margin defense | CFO | VP Sales, Pricing | Realized gross margin by segment |
| Channel conflict reduction | CRO | COO, CSCO | Unauthorized leakage rate |
| Quote-cycle acceleration | VP Sales | COO, Engineering | Quote-to-order cycle time |
| Attach-rate lift | VP Sales | Service leader, Finance | Attach rate by product family |
| Service-level stabilization | CSCO | Operations, Finance | Fill rate and expedite cost ratio |
Implementation Roadmap
A strong roadmap balances speed, control, and executive confidence. The recommended cadence is four phases over 9 to 18 months, with explicit stage gates.
8.1 Phase plan
| Phase | Duration | Strategic objective | Exit criteria |
|---|---|---|---|
| Phase 0: Financial baseline and governance setup | 4 to 6 weeks | Establish margin baseline, accountability, and decision rights | Signed scorecard, owners, and stage-gate criteria |
| Phase 1: Margin leak containment | 8 to 12 weeks | Execute top aftermarket recovery plays | Visible uplift in targeted segments |
| Phase 2: Quote and channel execution hardening | 12 to 20 weeks | Reduce quote friction and channel leakage | Measurable cycle-time and leakage improvements |
| Phase 3: Scale and optimize | Ongoing | Extend model across regions, portfolios, and channels | Sustained quarter-over-quarter gains |
8.2 Stage-gate logic
Do not move phases based on activity completion alone. Move phases only when financial and operational thresholds are met.
Gate A: Baseline integrity confirmed by finance and operations.
Gate B: First-wave recovery actions show repeatable results.
Gate C: Quote-cycle and channel controls are stable.
Gate D: Governance cadence sustains improvement without heroics.
8.3 Leadership operating rhythm
| Cadence | Participants | Focus | Decisions |
|---|---|---|---|
| Weekly | Program owners | Exception handling and unblockers | Immediate corrective actions |
| Monthly | CFO, CRO, COO, CSCO leads | KPI trend and root-cause review | Reallocate resources and priorities |
| Quarterly | CEO and C-suite | Value realization versus plan | Expand, pause, or redesign investment |
8.4 Technology placement in the roadmap
Technology decisions should be pulled by commercial priorities:
- In Phase 1, focus on capabilities that improve fitment confidence, pricing integrity, and entitlement actioning.
- In Phase 2, focus on capabilities that reduce quote exceptions and increase channel policy compliance.
- In Phase 3, focus on instrumentation, automation, and continuous optimization.
This keeps technology in service of margin outcomes, not the reverse.
Risk and Readiness Checklist
Many machinery programs underperform because they underestimate readiness constraints rather than strategic intent. Use this checklist before scaling spend.
| Risk domain | Readiness question | If "No," likely consequence |
|---|---|---|
| Financial baseline | Do finance and sales agree on margin and leakage definitions? | Value claims become untrusted |
| Installed-base visibility | Can teams identify where entitlement leakage is highest? | Recovery actions become generic |
| Pricing governance | Is waterfall accountability explicit by channel? | Gross-margin variance persists |
| Channel policy | Are direct and indirect roles commercially clear? | Conflict and arbitrage continue |
| Quote governance | Are approval thresholds and exception rules explicit? | Cycle-time gains stall |
| Ownership model | Is one accountable owner assigned per value pool? | Cross-functional drift slows execution |
| Change capacity | Can teams absorb cadence without exhausting core operations? | Program fatigue and reversals |
Top execution risks and controls
Risk: Over-indexing on broad transformation language.
Control: Tie every initiative to one named KPI and one named owner.
Risk: Treating long-tail parts as operational detail.
Control: Create a dedicated long-tail margin workstream with CFO visibility.
Risk: Ignoring dealer economics in direct-channel changes.
Control: Establish joint policy councils and escalation pathways.
Risk: Focusing only on lagging metrics.
Control: Track leading process indicators weekly.
C-Suite Decision Framework
Industrial machinery value recovery requires coordinated decisions across CEO, COO, CFO, CRO, CSCO, VP Sales, and VP Operations roles. The matrix below clarifies decisions by role and timing.
| Decision area | CEO | COO | CFO | CRO / VP Sales | CSCO / VP Operations |
|---|---|---|---|---|---|
| Margin ambition | Set outcome ambition and timeline | Validate operational feasibility | Validate EBIT and cash assumptions | Validate revenue capture upside | Validate fulfillment constraints |
| Installed-base strategy | Approve strategic focus accounts | Define execution model | Approve investment envelope | Set commercial plays and targets | Align service-level commitments |
| Channel design | Sponsor conflict resolution principles | Operationalize role boundaries | Evaluate price realization risk | Set field and partner coverage model | Ensure supply and service consistency |
| Quote-to-order policy | Endorse decision rights | Own process redesign | Enforce margin gates | Own cycle-time and conversion goals | Ensure manufacturability guardrails |
| Governance model | Chair quarterly business review | Run monthly operating review | Own value validation | Own commercial execution rhythm | Own service and inventory cadence |
Decision sequence that works
- Agree on economic truth: where margin is earned and lost.
- Agree on target value pools and ownership.
- Agree on stage gates and no-go criteria.
- Commit to a review cadence that can enforce trade-offs.
Without this sequence, programs default to departmental optimization and weaker enterprise outcomes.
KPI Model
The KPI model should connect activity to EBIT in a traceable chain. Keep metric definitions tight and stable for at least two full quarters before redesign.
11.1 Leading indicators
| KPI | Definition | Why it matters |
|---|---|---|
| Gap-to-entitlement coverage rate | Share of priority accounts with active recovery plans | Indicates whether capture motion is targeted |
| First-response speed for parts inquiries | Time from request to confident recommendation | Predicts channel retention and conversion |
| Quote exception rate | Share of quotes requiring non-standard escalation | Predicts cycle time and labor cost |
| Attach-offer consistency | Share of eligible quotes with lifecycle offers presented | Predicts recurring margin mix |
| Channel policy adherence | Share of transactions within defined channel rules | Predicts waterfall integrity |
11.2 Financial indicators
| KPI | Definition | CFO relevance |
|---|---|---|
| Aftermarket gross margin | Margin percent on parts and services | Core signal of margin recovery quality |
| Realized price variance | Difference between target and realized pricing outcomes | Detects waterfall erosion early |
| Recaptured aftermarket revenue | Revenue won back in targeted leakage pools | Quantifies entitlement recovery |
| Quote-to-order conversion value | Won value from targeted quote-cycle improvements | Connects speed to revenue quality |
| Service and parts attach margin | Incremental margin from attached offers | Measures servitization readiness |
11.3 KPI governance rules
- Keep one enterprise view and one functional drill-down.
- Report leading indicators weekly and financial indicators monthly.
- Attach owner names to every red metric.
- Require root-cause and action hypotheses for each variance.
This KPI discipline is where strategy becomes management.
Vendor and Platform Considerations
Selection should be framed around commercial fit, operating-model fit, and governance fit. Feature checklists alone do not protect the P&L. Evaluate every B2B eCommerce platform as an operating system for aftermarket spare-parts reorder, gap-to-entitlement recovery, long-tail parts pricing, quote-to-order, dealer portal control, fitment and supersession, and price waterfall governance, not as a storefront checklist.
12.1 Evaluation criteria
| Evaluation area | Decision question | Business significance |
|---|---|---|
| Installed-base and gap-to-entitlement support | Can the B2B eCommerce solution support entitlement-focused workflows at account and fleet level? | Critical for aftermarket recapture |
| Long-tail parts pricing | Does it support scalable long-tail parts pricing and lifecycle management workflows? | Critical for margin defense |
| Dealer portal and channel complexity | Can it handle dealer portal, distributor, and direct roles without price waterfall drift? | Critical for conflict reduction |
| Quote-to-order complexity | Can it support ETO/MTO/CTO quote-to-order governance and exception handling? | Critical for cycle-time and close quality |
| Fitment and supersession | Can it convert BOM/PLM truth into commerce-ready fitment and supersession decisions? | Critical for spare-parts conversion |
| Visibility and instrumentation | Can it surface actionable metrics by owner and workflow stage? | Critical for sustained execution |
| Operating resilience | Can teams run it without excessive manual workarounds? | Critical for adoption and long-run cost |
An ecommerce solution for industrial machinery OEMs should be judged on these operating outcomes, not on storefront feature count.
12.2 Source-quality reminders for executive teams
- Treat vendor CPQ claims as illustrative, not headline benchmarks.
- Keep major investment narratives anchored in independent sources.
- Use Gartner and McKinsey for behavior and economic framing.
- Use DC360 for market-sizing direction and channel progression.
- Keep medium-confidence sources clearly labeled in decision packs.
12.3 Confidence hierarchy
| Confidence level | Source types | Recommended use |
|---|---|---|
| High confidence | McKinsey, Gartner, Forrester, Deloitte, DC360 forecast | Headline investment case and board narrative |
| Medium confidence | Valtech and Copperberg via DC360, older McKinsey baseline studies | Directional support with qualification |
| Illustrative only | Vendor CPQ content (Cincom, Tacton), implementation marketing | Operational examples, never headline claims |
This hierarchy protects strategic decisions from overfitting to promotional data.
If your executive team agrees the installed base is your highest-leverage profit pool, the next step is not broad transformation rhetoric. It is a structured B2B eCommerce commercial and operational sprint with clear owners, stage gates, and value targets.
Choose the motion that fits your current maturity:
B2B eCommerce Discovery Sprint
Best when leadership needs a hard baseline on gap-to-entitlement leakage, long-tail parts pricing opportunity, aftermarket spare-parts reorder friction, and quote-to-order cycle time before committing larger spend.
2026 B2B Replatforming Playbook
Best when you already know where value leaks and need a phased execution blueprint that protects ongoing aftermarket revenue while upgrading B2B eCommerce capabilities.
B2B Platform Comparison Tool
Best when the team is evaluating multiple solution paths and needs a confidence-weighted comparison tied to industrial machinery realities, including dealer portal, fitment and supersession, and ETO/MTO/CTO quote-to-order requirements.
What success should look like in 12 months
- Higher aftermarket spare-parts capture through B2B eCommerce reorder and gap-to-entitlement recovery.
- Improved realized margin via long-tail parts pricing and price waterfall controls.
- Faster quote-to-order cycles in ETO/MTO/CTO motions with stronger service attach rates.
- Lower dealer portal conflict and grey-market leakage.
Reveation Labs helps industrial machinery teams turn a B2B eCommerce solution for Industrial Machinery into measurable commercial execution by connecting installed-base economics, dealer channel strategy, and quote-to-order governance into one operating system.
Start a B2B eCommerce Discovery Sprint with Reveation Labs to define the first wave of aftermarket value and de-risk execution before broader platform commitments.